Acumatica Financial Report with Dynamic Date Range Columns
Let’s say you want a report that can do something like this (Run it for May through August):
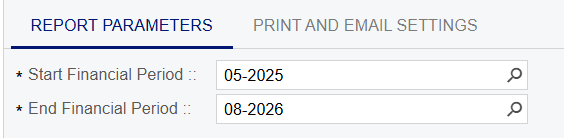
And it displays four columns:

Here is how to achieve it:
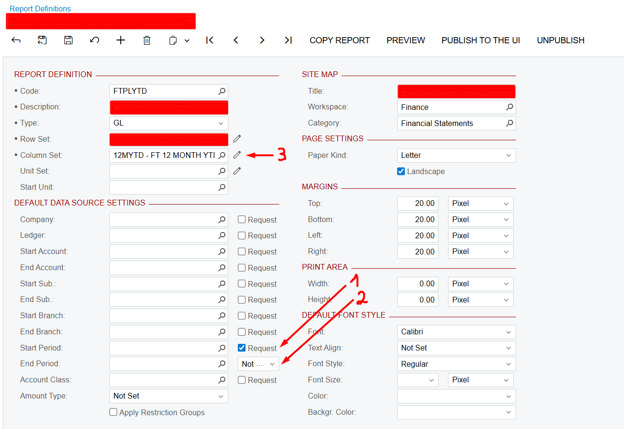
Step 1: Request the Start Period from the user
Step 2: Request the End Period from the user
Step 3: Edit the Column Set (this is where the “magic” happens)
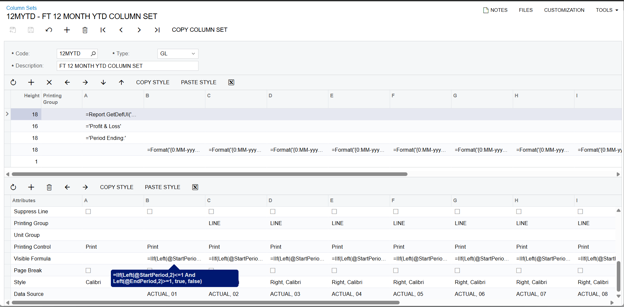
Step 4: Within the Column Set, create a separate column for each period (January through December, 12 columns total) and use the following formula in the Visible Formula row (making sure to change the 1s, 2s, 3s, etc. for each period). =IIf(Left(@StartPeriod,2)<=1 And Left(@EndPeriod,2)>=1, true, false)
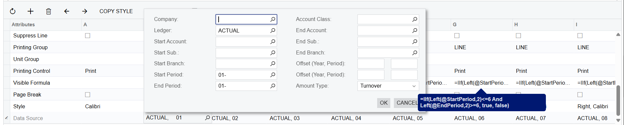
Step 5: Hardcode the month into the Data Source for each column to only pull data for that specific month. By following the screenshot below, you are only hardcoding the month, but not the year.
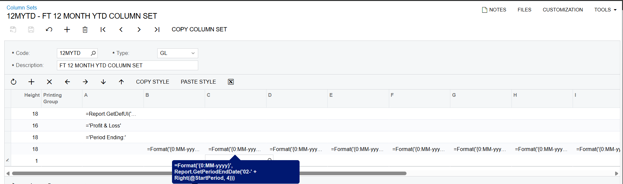
Step 6: Update the column header so that it dynamically shows the correct month and year based on the selected period parameters.
To do this, use a formula in the Header field that converts the period into a readable Month-Year format. For example:
=Format('{0:MM-yyyy}', Report.GetPeriodEndDate('01-' + Right(@StartPeriod, 4)))
Note: This method won’t work across multiple years. It will only work if the periods you are reporting on all fall within the same year.